Colour Coding the Data using the In Running Tab in Preferences
The colour coding of the In Running Highs and Lows throughout Proform can be changed from within the Preferences tab
You can get to the preferences in three ways
- From the buttons on the left sidebar
- From the Options Menu at the top of Proform, then click Preferences
- From the Preferences button at the top of the In Running Tab when viewing a race/result in data view.
Once you have the preferences open click on the In Running Tab and you will be presented with the following screen.
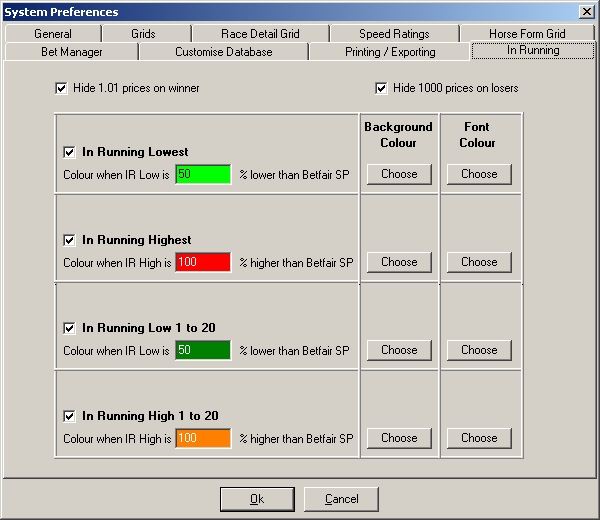
Here is an explanation of the various In Running Preferences
Hide 1.01 prices on winner
If you have this ticked then the In Running price of 1.01 will be replaced with a dash (-) wherever the In Running price is displayed. i.e. The race results screen, In Running tab in data view, drill down in system builder etc
There are some instances where horses win and do not reach 1.01, these In Running prices will still be shown.
Hide 1000 prices on winner
If you have this ticked then the In Running price of 1000 will be replaced with a dash (-) wherever the In Running price is displayed. i.e. The race results screen, In Running tab in data view, drill down in system builder etc. There are many instances when horses lose but do not reach 1000 In Running, these In Running prices will still be shown.
Note
- Most horses do reach 1000 in running but on many occasions it is to extremely small volumes, remember the In Running prices in Proform are only reported when the volume bet is at least £2, i.e. £1 on the back side and £1 on the lay side)
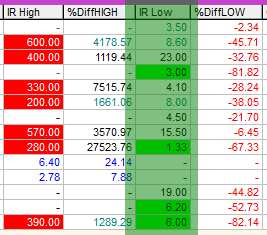
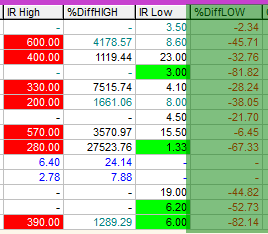
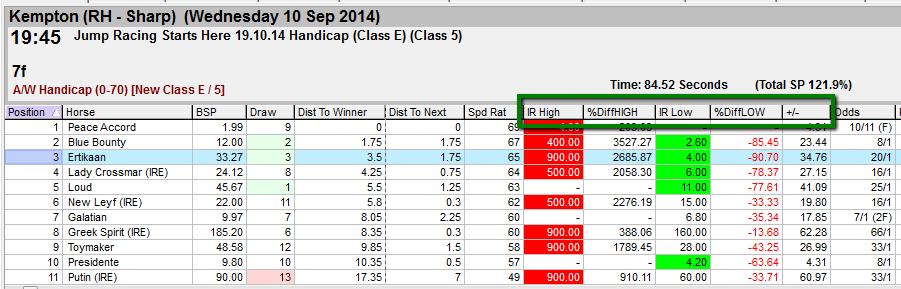
In Running Lowest
If you have this ticked then the colours and percentage you set for the In Running Low prices will be used throughout Proform and wherever the In Running Low price is displayed. i.e. The race results screen, In Running tab in data view, drill down in system builder etc.You can set the percentage lower than BSP to whatever you wish and by clicking the buttons at the side you can choose the background colour and font colour for the In Running Lows throughout Proform. Your chosen colours are displayed around the percentage you enter in this screen so you can see how they will look.
In Running Highest
If you have this ticked then the colours and percentage you set for the In Running High prices will be used throughout Proform and wherever the In Running High price is displayed. i.e. The race results screen, In Running tab in data view, drill down in system builder etc
You can set the percentage higher than BSP to whatever you wish and by clicking the buttons at the side you can choose the background colour and font colour for the In Running Highs throughout Proform. Your chosen colours are displayed around the percentage you enter in this screen so you can see how they will look.
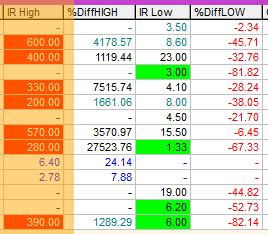
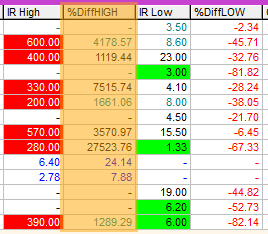
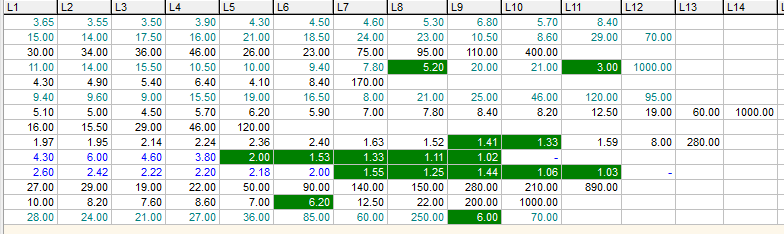
In Running Low 1 to 20
If you have this ticked then the colours and percentage you set for the In Running Low 1 to 20 prices will be used in Proform on the In Running tab in data view.
You can set the percentage lower than BSP to whatever you wish and by clicking the buttons at the side you can choose the background colour and font colour for the In Running Lows 1 to 20. Your chosen colours are displayed around the percentage you enter in this screen so you can see how they will look.
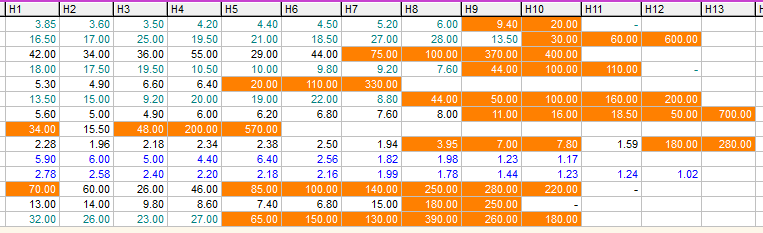
In Running High 1 to 20
If you have this ticked then the colours and percentage you set for the In Running High 1 to 20 prices will be used Proform on the In Running tab in data view.
You can set the percentage higher than BSP to whatever you wish and by clicking the buttons at the side you can choose the background colour and font colour for the In Running Highs 1 to 20. Your chosen colours are displayed around the percentage you enter in this screen so you can see how they will look.
Once you have set your In Running Colour Preferences, click OK and they will be remembered until you change them again and even if you close Proform they will be remembered the next time you use Proform.
Note
- If you have any In Running Prices on screen while changing the In Running Preferences, then after clicking OK they will not be reflected on screen until a refresh of the creen is done.)